VBA's Debugging Environment
VBA's debugging environment allows the programmer to momentarily suspend the execution of VBA code so that the following debug tasks can be done:
- Check the value of a variable in its current state.
- Enter VBA code in the Immediate window to view the results.
- Execute each line of code one at a time.
- Continue execution of the code.
- Halt execution of the code.
These are just some of the tasks that you might perform in VBA's debugging environment.
What is a Breakpoint?
A breakpoint is a selected line of code that once reached, your program will momentarily become suspended. Once suspended, you are able to use VBA's debugging environment to view the status of your program, step through each successive line of code, continue execution of the code, or halt execution of the code.
You can create as many breakpoints in your code as you want. Breakpoints are particularly useful when you want to suspend your program where you suspect a problem/bug exists.
Setting a Breakpoint
Next, let's take a look at how to set a breakpoint.
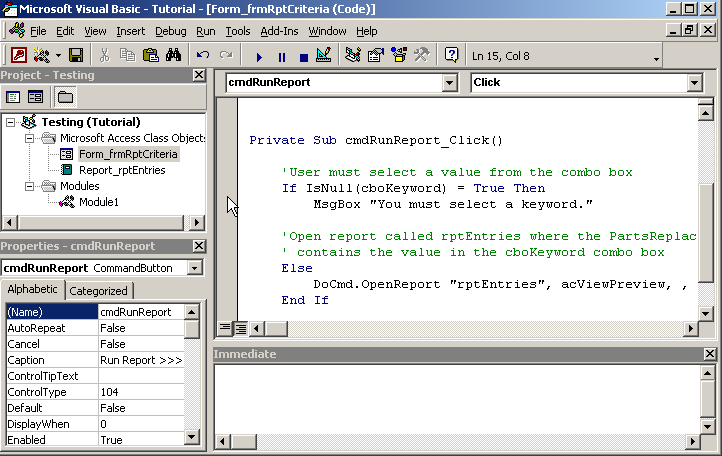
First, you need to access the VBA environment. The quickest way to do this is by pressing Alt-F11 while your Access database file is open.
To set a breakpoint, find the line of code where you'd like to suspend your program. Left-click in the grey bar to the left of the code. A red dot should appear and the line of code should be highlighted in red.
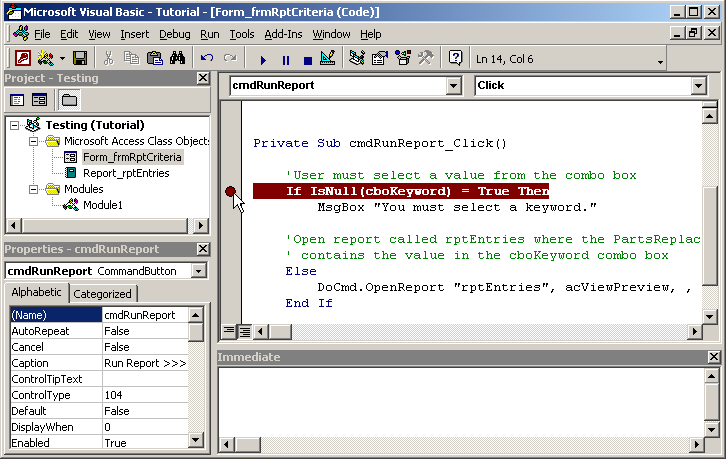
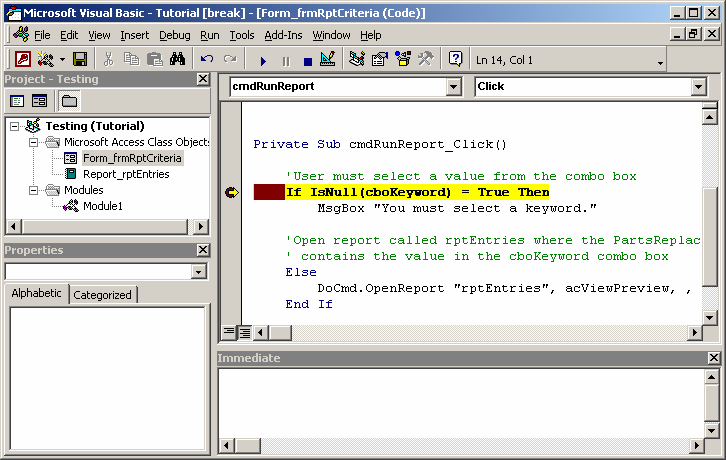
In this example, we've created a breakpoint at the following line of code:
If IsNull(cboKeyword) = True Then
Clearing a Breakpoint
To clear a breakpoint, left-click on the red dot next to the line of code that has the breakpoint.
In this example, we want to clear the breakpoint at the following line of code:
If IsNull(cboKeyword) = True Then
Now, the breakpoint is cleared and the line of code should look normal again.
Clearing all Breakpoints
Because you can set as many breakpoints as you want, you can save time by clearing all breakpoints in your VBA code at once.
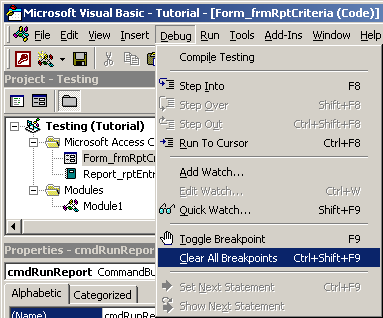
To clear all breakpoints in your program, select "Clear All Breakpoints" under the Debug menu.
This will remove all breakpoints from your VBA code, so that you don't have to individually remove each breakpoint, one by one.
Now that we know how to set and clear breakpoints, let's take a closer look at the debug mode in VBA.
In our example, we've set our breakpoint and executed the VBA code by clicking on the command button called cmdRunReport.
When the breakpoint is reached, Access will display the Microsoft Visual Basic window and highlight the line (in yellow) where the code has been suspended.
Checking values
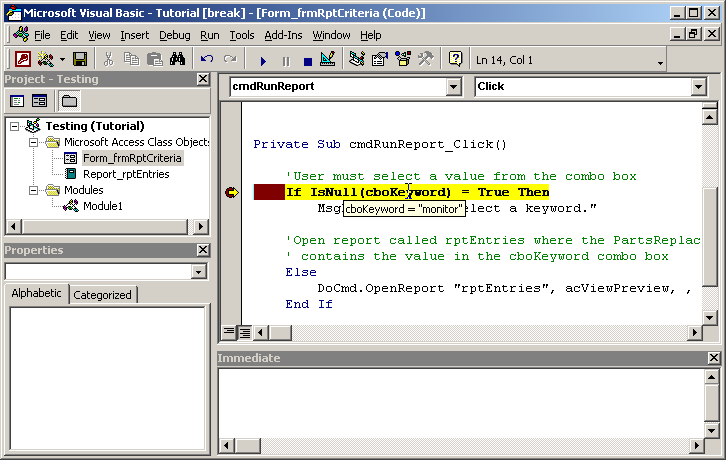
If you want to view the value of a variable or object (ie: text box, combo box, etc) in your VBA code at the time that the program was suspended, you can move your mouse pointer over that VBA code. Bubble text will appear displaying the variable/object name and its value in its current state.
In this example, we've moved the mouse pointer over the combo box called cboKeyword. The bubble text displays the cboKeyword combo box name with a value of "monitor".
This feature is useful if you need to quickly check a variable/object in your code.
Using the Immediate Window
The Immediate window can be used to debug your program by allowing you to enter and run VBA code in the context of the suspended program.
We've found the Immediate window to be the most help when we need to find out the value of a variable, expression, or object at a certain point in the program. This can be done using the print command.
For example, if you wanted to check the current value of the combo box called cboKeyword, you could use the print command as follows:
In this example, we typed print cboKeyword And pressed ENTER. The Immediate window displayed the result in the next line. In this case, the print cboKeyword command returned monitor.
You can also type more complicated expressions in the Immediate window. (Remember to press ENTER.) For example:
The Immediate window can be used to run other kinds of VBA code, but bear in mind that the Immediate window can only be accessed when debugging so any code that you run is for debugging purposes only.
In this example, the Immediate window can be used to open a report called rptEntries.
Choose how to move through your code
Now that you've suspended execution of your program and are in debug mode, you need to choose how to proceed through your code. We'll cover the 4 most common choices.
- Step Into
- Step Over
- Continue
- Halt
Let's take a look at each of these.
Step Into
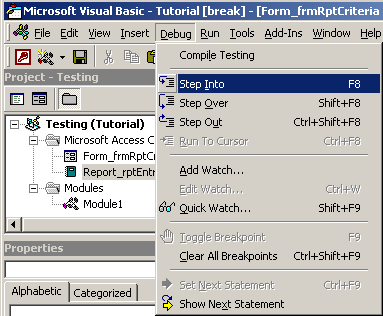
You can choose to "Step Into" your code. What this means is that you will step through each line of code in your current procedure as well as step into the code of any procedures that are called by the current procedure.
You can do this by either pressing the F8 key or selecting "Step Into" under the Debug menu.
Each time you select "Step Into", the debugger will move you to the next line of code.
Step Over
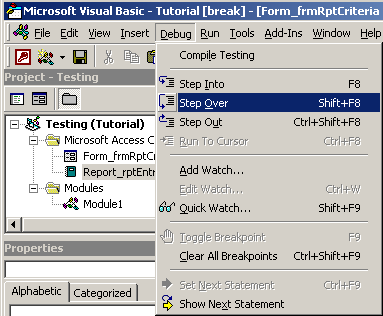
You can choose to "Step Over ". What this means is that you will step through each line of code in your current procedure, but step over (ie: run as a unit) any procedures that are called by the current procedure.
You can do this by either pressing the Shift-F8 key or selecting "Step Over" under the Debug menu.
Each time you select "Step Over", the debugger will move you to the next line of code in your current procedure. If your current procedure calls another procedure, the debugger will step over the called procedure. It won't drill down into the code of the called procedure.
Continue
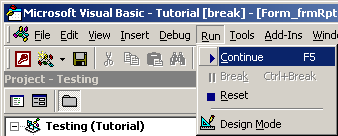
You can choose to "Continue" execution of your code. What this means is that your suspended program will continue executing from where it left off. With this option, your program should either finish running or suspend at the next breakpoint encountered.
You can do this by either pressing the F5 key or selecting "Continue" under the Run menu.
Halt
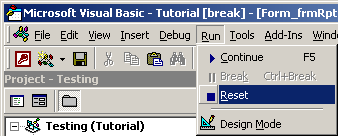
You can choose to "Halt" execution of your code. What this means is that your suspended program will halt execution. You will no longer be in debug mode.
You can do this by selecting "Reset" under the Run menu.
You would normally select this option after you've identified the bug in your code. Once your code is halted, you can modify your VBA code to remedy the problem.
Congratulations! You've just completed the tutorial on Debugging VBA Code.

